The challenge of urban growth and land use land cover (LULC) change is particularly critical in developing countries. The use of remote sensing and GIS has helped to generate LULC thematic maps, which have proven immensely valuable in resource and land-use management, facilitating sustainable development by balancing developmental interests and conservation measures. The research utilized socio-economic and spatial variables such as slope, elevation, distance from streams, distance from roads, distance from built-up areas, and distance from the center of town to determine their impact on the LULC of 2016 and 2019. The research integrates Artificial Neural Network with Cellular Automta to forecast and establish potential land use changes for the years 2025 and 2040. Comparison between the predicted and actual LULC maps of 2022 indicates high agreement with kappa hat of 0.77 and a percentage of correctness of 86.83%. The study indicates that the built-up area will increase by 8.37 km 2 by 2040, resulting in a reduction of 7.08 km 2 and 1.16 km 2 in protected and agricultural areas, respectively. These findings will assist urban planners and lawmakers to adopt management and conservation strategies that balance urban expansion and conservation of natural resources leading to the sustainable development of the cities.
The demographic projections suggest that the Central and Southern Asia are poised to emerge as the world’s most populous region by 2037 [1]. Furthermore, India surpassed China to become the most populous country in the year 2023, and prevailing indications anticipate the persistence of this demographic trend for several decades [2]. The unrestrained expansion of built-up areas is majorly propelled by a substantial increase in population which ultimately leads to land use land cover (LULC) changes [3,4,5].
The significant characteristics of urban sprawl are a rapid decrease in vegetated areas [6, 7], random and unplanned growth [8, 9], increased economic activities in higher elevations [10,11,12], land cover change in agricultural areas [13,14,15,16], and increase in urban heat island [17,18,19]. This has created environmental, ecological, economic, and social challenges [8]. The changes, geographical and climatic, occurring in Himalayan cities call for special attention due to the geo-morphological, topographical, and seismic constraints [7, 10, 20, 21]. Thus, the monitoring of spatio-temporal expansion of the cities and accurate prediction of LULC change is vital for ecosystem conservation and sustainable development management strategies to be implemented in these regions [22]. As per the year-wise records shared by the Department of Economics and Statistics, State Government of Himachal Pradesh in India, the class III cities having a population of less than 50,000 in the state were found to be more vulnerable to urban sprawl due to saturation in capital city Shimla, and thus, there is a pressing need to balance economic development with sustainable environmental practices.
The integrated use of remote sensing and GIS has helped immensely in the management of land and natural resources and in understanding the complex linkages between spatial patterns and processes responsible for change [7, 23,24,25]. Thus, the modeling and accurate prediction of urban sprawl has been inviting the attention of various researchers [26, 27], and the use of modern self-learning algorithms has further improved the accuracy of these models [28,29,30,31]. The understanding of dynamic changes occurring in the region and the incorporation of driving factors also improves the accuracy of these models [26].
Cellular automata (CA)-based models are spatially explicit models (SEM) that work on a simple premise that the future state of a land cover type is dependent on the past local interactions between the different land covers [22, 26]. The model’s popularity in GIS grew immensely in the 1980s, catalyzed by pivotal contributions from Wolfarm [32], Michael Batty and Xie [33], and Batty et al. [34]. The accuracy of the model was dependent upon the temporal scale of maps, neighboring cells, and transition rules [35, 36]. Batty [34], Leao [37], and Lagarias [38] found them to be powerful spatial dynamic models. The open structure, simplicity, good spatial resolution, and integration with other knowledge-driven models make it an appropriate choice for urban sprawl studies [22, 26, 35, 39]. However, the model is dependent upon spatial data only and is limited in implementing driving forces which is important for complex processes and accurate simulation [22, 26]. The non-uniform cell space, dynamic neighborhood classes, and non-stationary transition rules offer opportunities for modification in the original CA structure to make it applicable for real-time complex urban sprawl studies [22, 35]. This makes it necessary to integrate CA with other models.
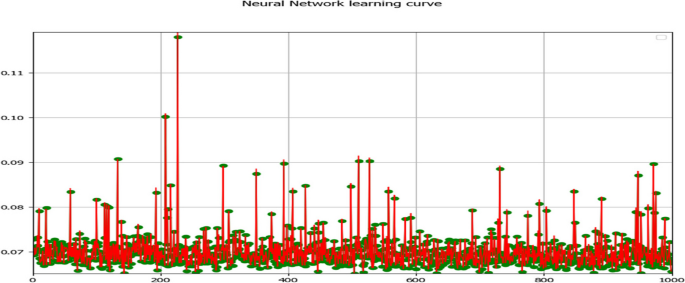
To address the inherent constraints in the individual models, various researchers have employed hybrid models like CA–Markov model [40] and CA-ANN model [41]. The integration of spatial patterns with the processes responsible for causing changes in landforms is imperative for the accurate prediction and modeling of land cover changes [24]. Artificial neural networks (ANN) can identify and analyze the complex inter-relationship between causative factors and complex patterns [26, 42]. The architecture of ANN simulates and behaves in a similar pattern as the human brain and nervous system [43,44,45]. ANN can deal with incomplete data, does not assume the distribution of input data, and can detect potential inter-dependencies between driving factors [46, 47]. Multi-layer perceptron (MLP)-ANN, consists of input layers, hidden layers, and an output layer, and is the widely used model in ANN because it is fast, accurate, and can infer and forecast outcomes derived from inputs that it has not encountered previously, exhibiting the capacity for extrapolation and prognostication [48]. Researchers have adeptly employed CA-ANN models to address spatial-dynamic complexities and driving factors, enhancing the robustness and realism of modeling for accurate prediction and estimation of land cover changes [18, 39, 42, 49, 50].
The study aims to model LULC change using MLP-ANN and cellular automation simulation in the city of Dharamshala, one of the fastest-growing cities in the state of Himachal Pradesh, India. The results are expected to act as a road map for urban planners and policymakers for sustainable development of the city. The research used the MOLUSCE plugin, as a tool to predict and assess the transformations occurring in each LULC type in the study area. In the study, LULC maps of 2016 and 2019 were used as independent variables in the model to simulate and validate the LULC map of 2022, and thereafter, LULC maps of 2025 and 2040 were predicted.
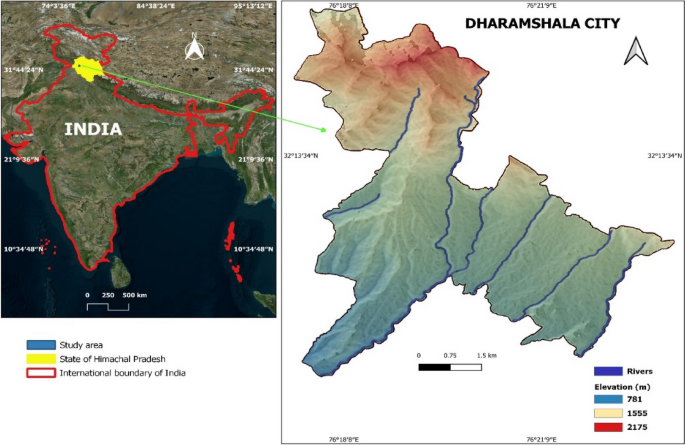
The research locale encompasses Dharamshala, situated in the state of Himachal Pradesh, India, as illustrated in Fig. 1. Positioned within the Western Himalayas, the city graces the southern inclines of the principal regional Dhauladhar mountain range (V. Gupta et al., [51]). Geographically, the study vicinity spans from 32° 9′ 52″ N to 32° 15′ 58″ N in latitude and 76° 17′ 22″ E to 76° 23′ 09″ E in longitude, encompassing an expanse of 42.7 km 2 . Elevation within this area exhibits variability, ranging from 790 m in the southwest to an altitude of 2130 m above mean sea level (AMSL) in the north. The region has a humid subtropical climate and experiences a mean annual temperature of about 19.1 ± 0.5 °C. The zenith of temperature occurs in June with an average of 32 °C, while the nadir registers in January with an average of 10 °C. The northern parts of the region also receive heavy snowfall during winter. Geologically, the region forms a part of the Outer Himalayas with a predominant geological composition comprising sandstone, characterized by alternating bands of clays, shale, and siltstones (V. Gupta et al., [51]).
The city is the winter capital of the state of Himachal Pradesh and the headquarters of the Central Tibetan Administration. The city is a famous hill station destination, both for national and international visitors. Further, it is also the administrative headquarters of Kangra district. The city was declared a municipal corporation in the year 2015 by merging 9 adjacent villages and has ever since witnessed rapid urbanization. It is one among the 100 cities in India and the only city in the state of Himachal Pradesh chosen in the year 2016 to be developed under the National Smart Cities Mission by the Government of India.
A dramatic rise in urban spaces has been witnessed in the city from the year 2016 onwards, and there exists an inherent imperative to address the recent alterations that have manifested within this geographical area through a scientific lens. The time scale chosen in the study corresponds to the maximum socio-economic changes occurring in the city due to the formation of municipal limits, hosting of international cricket matches and also serving as the residence of His Holiness Dalai Lama.
The simulation’s correctness is determined by the quality of the data and criteria used in the investigation [26, 35, 39]. The month of May is characterized by sunny days with no or little rainfall in the region; thus, all the temporal satellite imageries were chosen from this month to negate the impacts of phenological effects and cloudy pixels [52]. The ancillary data included a draft town and country planning (TCP) report of Dharamshala city and ground truth points (using GPS) for assistance and validation in image classification.
The study incorporated LULC maps of 2016, 2019, and 2022 and digital elevation model (DEM), the details of which are given in Table 1. Multi-temporal Landsat 8 Operational land Imager (OLI) satellite imageries for the years 2016, 2019, and 2022 were used, the description of which is shown in Table 2. A hybrid approach involving a Maximum Likelihood Classifier (MLC) and thereafter adopting post-classificaton improvement measures using vegetation indices was used in the research study to create LULC maps of 2016, 2019, and 2022 with each LULC map attaining an overall accuracy surpassing 85% and kappa hat showing substantial agreement. The selection of the Maximum Likelihood Classifier was based on the topographical challenges and spectrally homogeneous attributes of the land cover classes under investigation. The correction of the land cover classes through visual interpretation becomes essential by utilizing high-resolution satellite imagery obtained from Google Earth and Planet Scope [53, 54].
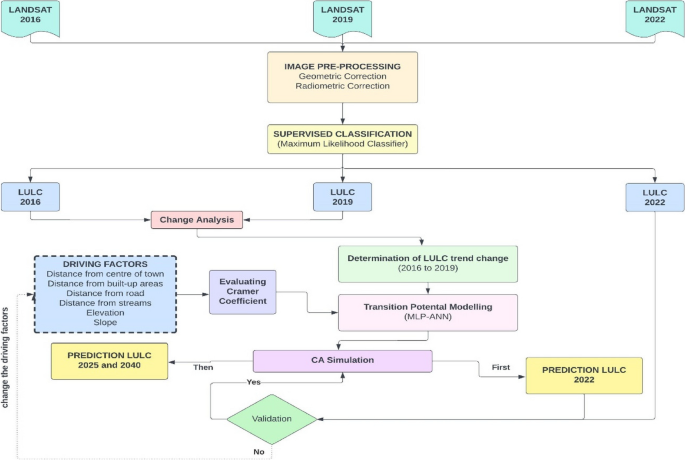
The transition probabilities derived from MLP-ANN learning processes are fed into CA to predict and estimate the LULC changes in this hybrid model of CA-ANN [31, 49].
The satellite imageries of 2016, 2019, and 2022 were transformed to spectral radiance values, and the Dark Object Subtraction (DOS) in the semi-automatic classification (SCP) plugin in QGIS was used for performing atmospheric correction. Thereafter, the images were mosaicked, and an image subset was performed using the shapefile of the municipal corporation limits of Dharamshala city. The shape file of municipal limits was geometrically corrected with the use of ground control points (GCP) selected using GPS. This was executed in a manner that ensured the Root mean Squared Error (RMSE) attained a value of less than half of a pixel [55].
Modified Anderson’s LULC classification system was adopted to produce thematic maps comprising five LULC classes, Protected areas (PA), Agricultural areas (AA), Built-up Areas (BA), Barren land (BL), and Water bodies (WB), as shown in Table 3, for the years 2016, 2019, and 2022. Supervised classification using MLC was used for the creation of the five land cover classes [7, 20, 53, 56, 57]. The forests are protected under Indian Forest Act, 1927, and the tea plantations are protected under Himachal Pradesh Ceiling on Land Holdings Act, 1972, and thus were classified under the protected areas (PA).
The transition functions are non-linear and represent the relationship between driving factors and transformation probabilities of land cover type [26, 39]. ANN model is trained on explanatory maps, and then the transition probabilities are established for the CA model. The prediction of transition probabilities from the current land use type to different LULC categories at the subsequent time point, denoted as “t + 1,” was determined by taking into account the current LULC classification of a specific cell as well as the neighboring cells at time t.
Based on spatio-temporal dynamics and the impact of driving factors, the simulation is initially performed for the year 2022, and based on the performance of the model, the predictions are thereafter made for the years 2025 and 2040 in the iterative steps of two and six, respectively, in the model.
The examination of correlation among the driving factors was executed using the Cramer coefficient, also known as the Cramer V method, particularly suitable for contingency tables larger than 2 × 2. The outcomes span a range of 0 to 1, where elevated values signify a heightened correlation amid the driving factors. A coefficient surpassing 0.15 indicates a substantial explanatory potency of variables [49]. The correlation matrix is shown in Table 4.
In LULC simulation, the cross-tabulation matrix, also referred to as a contingency table, error matrix, or confusion matrix, stands as an extensively utilized approach for the evaluation of outcomes [62]. Cross-tabulation facilitates a comparative analysis between the outcomes projected by the model and the observed outcomes [63]. In this matrix, each row corresponds to the anticipated category, while each column signifies the factual category, thereby showcasing discrepancies in the cells, often expressed as errors represented in percentages or areas [27, 64].
The assessment of accuracy was conducted utilizing overall accuracy and kappa hat statistics as the metrics of evaluation. Both metrics use the confusion matrix for calculation purposes. The determination of overall accuracy involves the consideration of diagonal elements only within the confusion matrix, while the kappa hat also considers non-diagonal elements and thus incorporates omission and commission errors [64]. Kappa hat evaluates the land modeling performance excluding chance agreement [65], with values ranging from 0.41 to 0.60 categorized as “moderate agreement” and 0.61 to 0.80 as “substantial agreement” [27, 66].
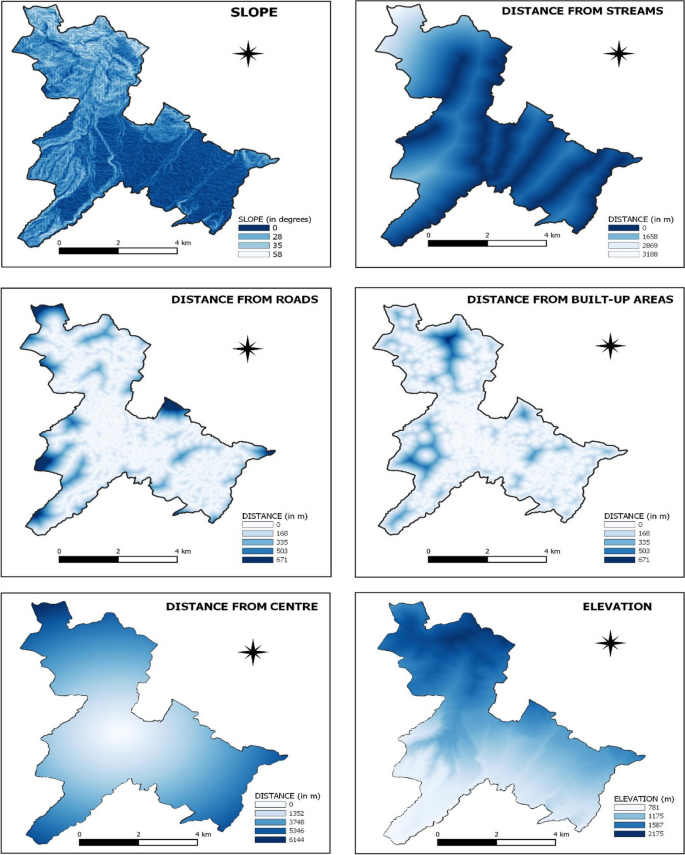
Several simulations with different combinations of exploratory maps were performed, as shown in Table 7. The combination consisting of the parameters distance from built-up areas, distance from roads, distance from the center of town, elevation, slope, and distance from streams showed the maximum accuracy and was chosen in the research study to prognosticate the LULC for the year 2022. The simulated and actual maps were compared with the accuracy metric kappa having a value of 0.77 denoting a notable concordance between both the maps and accuracy was found to be 86.83%. It can be concluded from these that the explanatory variables chosen had a great influence on the prediction of LULC classes. The maps for the years 2025 and 2040 were predicted after running two and seven iterations in CA, respectively.
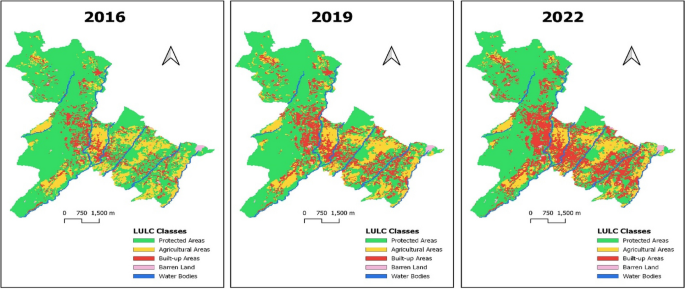
The increase in built-up areas and barren land for the period 2016–2022 is primarily related to the increasing human population and tourist inflow in the city, leading to additional need for residential and commercial spaces. This led to high pressure on the protected areas and agricultural areas, which had suffered maximum depreciation for this period.
The region lying at an altitude of less than 1500 m remained the most critical with maximum changes in LULC classes being witnessed there. The built-up areas, agricultural areas, and protected areas showed maximum transition in this region. The main reason for this could be attributed to the better transportation facilities, road connectivity, suitable climatic conditions for living and agricultural practices, commercial establishments, and more population concentration in this region. Higher altitude regions, because of terrain and other geographical constraints, are less vulnerable to built-up areas. Thus, the city requires greater concern and attention from policymakers and environmentalists to pave the way for a balanced, holistic, and sustainable development model.
The simulation and accurate prediction of LULC become necessary to understand the trend and direction of urban sprawl. The LULC maps of 2025 and 2040 were prepared using CA modeling, and the spatial distribution of these LULC maps is shown in Fig. 6. Six driving factors, distance from built-up areas, distance from roads, distance from the center of town, elevation, slope, and distance from streams, were chosen for the modeling.
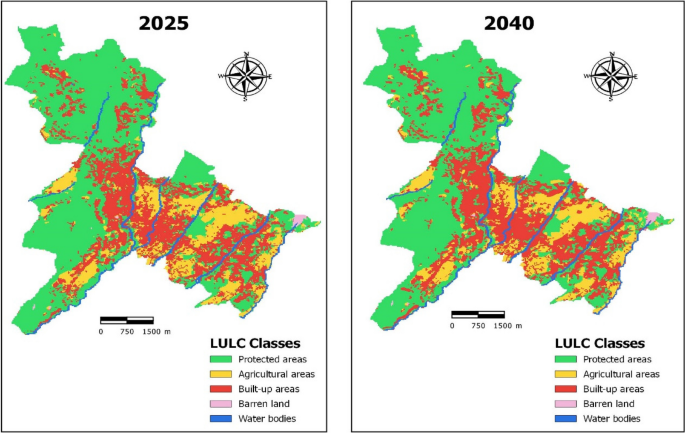
The LULC change analysis of the maps from 2016 to 2025 and 2016 to 2040 is shown in Tables 10 and 11. The results indicate the continuation of the trend of increase in the built-up areas and a decrease in protected areas for the year 2025. However, the increase in built-up areas will saturate after 2025, and the percentage increase in built-up areas for 3 years will be reduced as compared to the previous 3-year transition. This could be attributed to the fact that most of the usable and productive areas for construction will be exhausted.
Table 10 LULC change analysis from 2016 to 2025 Table 11 LULC change analysis from 2016 to 2040The hilly areas offer geographical and topographical constraints for construction, and thus, the ideal locations for construction are usually those located at mid-altitudes and having less slope. The seismicity of the area is another challenge. All these factors will lead to construction in high seismic and landslide-prone areas, which would present a significant impediment to the well-being and security of the inhabitants. Another important observation from the findings was that the transition of built-up areas on the temporal scale is usually restricted to mid and south-eastern regions of the study area. The region has witnessed urban sprawl in these pockets and will remain a critical region in the future.
The swift expansion of urbanized regions, stemming from demographic expansion and the influx of tourists, emphasizes the critical significance of implementing sustainable urban planning strategies. Effective land-use management strategies should be implemented by policymakers and urban planners involving the promotion of efficient land use, reducing urban sprawl, and preserving green spaces, contributing to the attainment of Sustainable Development Goal (SDG) 11, which focuses on creating sustainable cities and communities.
The decline in protected areas is a matter of concern as it poses a threat to biodiversity and ecosystems. Strict implementation of legislation, with the involvement of environmentalists and policymakers, can help protect and restore these areas, thus preserving biodiversity and ensuring the long-term sustainability of natural resources. This effort directly relates to SDG 15, which focuses on maintaining and enhancing life on land.
Land-use planning plays a crucial role in fostering responsible consumption and production patterns. By optimizing land use and preventing further encroachment on protected areas, policymakers can contribute to sustainable resource management and reduce the environmental impact of human activities, which aligns with the objectives of SDG 12, aiming to ensure responsible consumption and production.
The increasing population and tourists will remain the major driving factors for the change. The decrease in agricultural areas indicates a shift in agriculture practice, which lately has been the preferred occupation of the residents. Further, the decrease in protected areas indicates the persistent encroachments and abeyance of legislation. In order to address the decreasing agricultural areas, it is crucial to promote sustainable farming practices and increase agricultural productivity to address the escalating requirements of sustenance. This can be accomplished through the implementation of innovative techniques, support for small-scale farmers, and ensuring food security for all, thereby working towards achieving Zero Hunger (SDG-2).
The study applied ANN-based CA approach for prediction of land cover classes which showed substantial agreement between the simulated and the actual LULC map, with the accuracy metric kappa showing a value of 0.77. The model incorporated six driving factors, out of which four were socio-economic spatial parameters, distance from built-up areas, roads, center of town, and streams; while two were geospatial parameters, elevation, and slope. These criteria combinations performed the best in the CA-ANN model showing the highest value of accuracy of 86.83%.
The selection of these factors was based on their potential influence on the study’s outcomes. For instance, proximity to built-up areas may impact pollution levels and development rates, while distance from roads may correlate with traffic noise and urbanization patterns. Elevation and slope could affect water resource accessibility, and proximity to streams might indicate water source quality.
The study predicts that the built-up areas will increase by 17.84% in the year 2025 and 19.69% by the year 2040. The protected areas will decrease by 14.75% and 16.66%, agricultural areas by 2.81% and 2.72%, and barren land by 0.29% and 0.31% for the years 2025 and 2040, respectively.
The rapid increase in population and tourism has led to a significant rise in built-up areas, creating an urgent demand for more land and putting undue pressure on protected areas and agricultural areas. Strict implementation of legislation is necessary to prevent further encroachments in the protected areas. Studying the critical land-use classes in terms of socio-ecological and environmental concerns is valuable for balancing environmental pressures and conservation interventions. The findings can offer guidance to administrators, policymakers, agricultural practitioners, and urban planners in formulating methodologies for sustainable land-use planning and management, fostering the optimal utilization of natural resources.
The data used in the study was downloaded from USGS (https://earthexplorer.usgs.gov/) and is available openly. It is further declared that the data related to the study will be shared upon request.
It is further certified that the research complies with ethical standards, there was no funding for this research, and there are no potential conflicts of interest (financial or non-financial).