Plot [ … , < x >∈ reg ] takes the variable x to be in the geometric region reg .
| Annotation [ f i , label ] | provide an annotation for the f i |
| Button [ f i , action ] | evaluate action when the curve for f i is clicked |
| Callout [ f i , label ] | label the function with a callout |
| Callout [ f i , label , pos ] | place the callout at relative position pos |
| EventHandler [ f i , events ] | define a general event handler for f i |
| Highlighted [ f i , effect ] | dynamically highlight f i with an effect |
| Highlighted [ f i , Placed [ effect , pos ] ] | statically highlight f i with an effect at position pos |
| Hyperlink [ f i , uri ] | make the function a hyperlink |
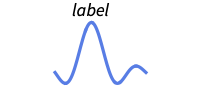
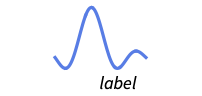
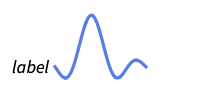
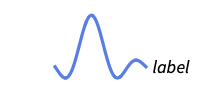
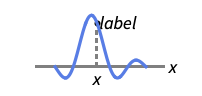
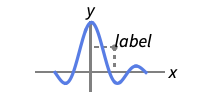
| Labeled [ f i , label ] | label the function |
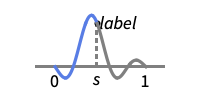
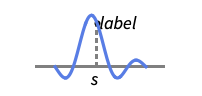
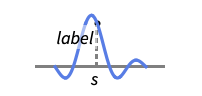
| Labeled [ f i , label , pos ] | place the label at relative position pos |
| Legended [ f i , label ] | identify the function in a legend |
| PopupWindow [ f i , cont ] | attach a popup window to the function |
| StatusArea [ f i , label ] | display in the status area on mouseover |
| Style [ f i , styles ] | show the function using the specified styles |
| Tooltip [ f i , label ] | attach a tooltip to the function |
| Tooltip [ f i ] | use functions as tooltips |
| AspectRatio | 1/GoldenRatio | ratio of height to width |
| Axes | True | whether to draw axes |
| ClippingStyle | None | what to draw where curves are clipped » |
| ColorFunction | Automatic | how to determine the coloring of curves |
| ColorFunctionScaling | True | whether to scale arguments to ColorFunction |
| EvaluationMonitor | None | expression to evaluate at every function evaluation |
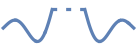
| Exclusions | Automatic | points in x to exclude |
| ExclusionsStyle | None | what to draw at excluded points |
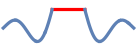
| Filling | None | filling to insert under each curve |
| FillingStyle | Automatic | style to use for filling |
| LabelingSize | Automatic | maximum size of callouts and labels |
| MaxRecursion | Automatic | the maximum number of recursive subdivisions allowed |
| Mesh | None | how many mesh points to draw on each curve |
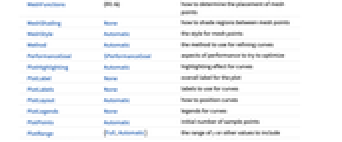
| MeshFunctions | | how to determine the placement of mesh points |
| MeshShading | None | how to shade regions between mesh points |
| MeshStyle | Automatic | the style for mesh points |
| Method | Automatic | the method to use for refining curves |
| PerformanceGoal | $PerformanceGoal | aspects of performance to try to optimize |
| PlotHighlighting | Automatic | highlighting effect for curves |
| PlotLabel | None | overall label for the plot |
| PlotLabels | None | labels to use for curves |
| PlotLayout | Automatic | how to position curves |
| PlotLegends | None | legends for curves |
| PlotPoints | Automatic | initial number of sample points |
| PlotRange | < Full , Automatic > | the range of y or other values to include |
| PlotRangeClipping | True | whether to clip at the plot range |
| PlotStyle | Automatic | graphics directives to specify the style for each curve |
| PlotTheme | $PlotTheme | overall theme for the plot |
| RegionFunction | ( True& ) | how to determine whether a point should be included |
| ScalingFunctions | None | how to scale individual coordinates |
| TargetUnits | Automatic | units to display in the plot |
| WorkingPrecision | MachinePrecision | the precision used in internal computations |
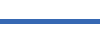
| AlignmentPoint | Center | the default point in the graphic to align with |
| AspectRatio | 1/GoldenRatio | ratio of height to width |
| Axes | True | whether to draw axes |
| AxesLabel | None | axes labels |
| AxesOrigin | Automatic | where axes should cross |
| AxesStyle | | style specifications for the axes |
| Background | None | background color for the plot |
| BaselinePosition | Automatic | how to align with a surrounding text baseline |
| BaseStyle | | base style specifications for the graphic |
| ClippingStyle | None | what to draw where curves are clipped |
| ColorFunction | Automatic | how to determine the coloring of curves |
| ColorFunctionScaling | True | whether to scale arguments to ColorFunction |
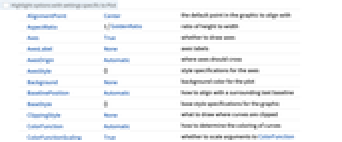
| ContentSelectable | Automatic | whether to allow contents to be selected |
| CoordinatesToolOptions | Automatic | detailed behavior of the coordinates tool |
| Epilog | | primitives rendered after the main plot |
| EvaluationMonitor | None | expression to evaluate at every function evaluation |
| Exclusions | Automatic | points in x to exclude |
| ExclusionsStyle | None | what to draw at excluded points |
| Filling | None | filling to insert under each curve |
| FillingStyle | Automatic | style to use for filling |
| FormatType | TraditionalForm | the default format type for text |
| Frame | False | whether to put a frame around the plot |
| FrameLabel | None | frame labels |
| FrameStyle | | style specifications for the frame |
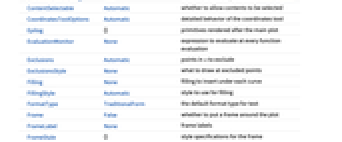
| FrameTicks | Automatic | frame ticks |
| FrameTicksStyle | | style specifications for frame ticks |
| GridLines | None | grid lines to draw |
| GridLinesStyle | | style specifications for grid lines |
| ImageMargins | 0. | the margins to leave around the graphic |
| ImagePadding | All | what extra padding to allow for labels etc. |
| ImageSize | Automatic | the absolute size at which to render the graphic |
| LabelingSize | Automatic | maximum size of callouts and labels |
| LabelStyle | | style specifications for labels |
| MaxRecursion | Automatic | the maximum number of recursive subdivisions allowed |
| Mesh | None | how many mesh points to draw on each curve |
| MeshFunctions | | how to determine the placement of mesh points |
| MeshShading | None | how to shade regions between mesh points |
| MeshStyle | Automatic | the style for mesh points |
| Method | Automatic | the method to use for refining curves |
| PerformanceGoal | $PerformanceGoal | aspects of performance to try to optimize |
| PlotHighlighting | Automatic | highlighting effect for curves |
| PlotLabel | None | overall label for the plot |
| PlotLabels | None | labels to use for curves |
| PlotLayout | Automatic | how to position curves |
| PlotLegends | None | legends for curves |
| PlotPoints | Automatic | initial number of sample points |
| PlotRange | < Full , Automatic > | the range of y or other values to include |
| PlotRangeClipping | True | whether to clip at the plot range |
| PlotRangePadding | Automatic | how much to pad the range of values |
| PlotRegion | Automatic | the final display region to be filled |
| PlotStyle | Automatic | graphics directives to specify the style for each curve |
| PlotTheme | $PlotTheme | overall theme for the plot |
| PreserveImageOptions | Automatic | whether to preserve image options when displaying new versions of the same graphic |
| Prolog | | primitives rendered before the main plot |
| RegionFunction | ( True& ) | how to determine whether a point should be included |
| RotateLabel | True | whether to rotate y labels on the frame |
| ScalingFunctions | None | how to scale individual coordinates |
| TargetUnits | Automatic | units to display in the plot |
| Ticks | Automatic | axes ticks |
| TicksStyle | | style specifications for axes ticks |
| WorkingPrecision | MachinePrecision | the precision used in internal computations |